Measurement Groups
for Construction Takeoffs
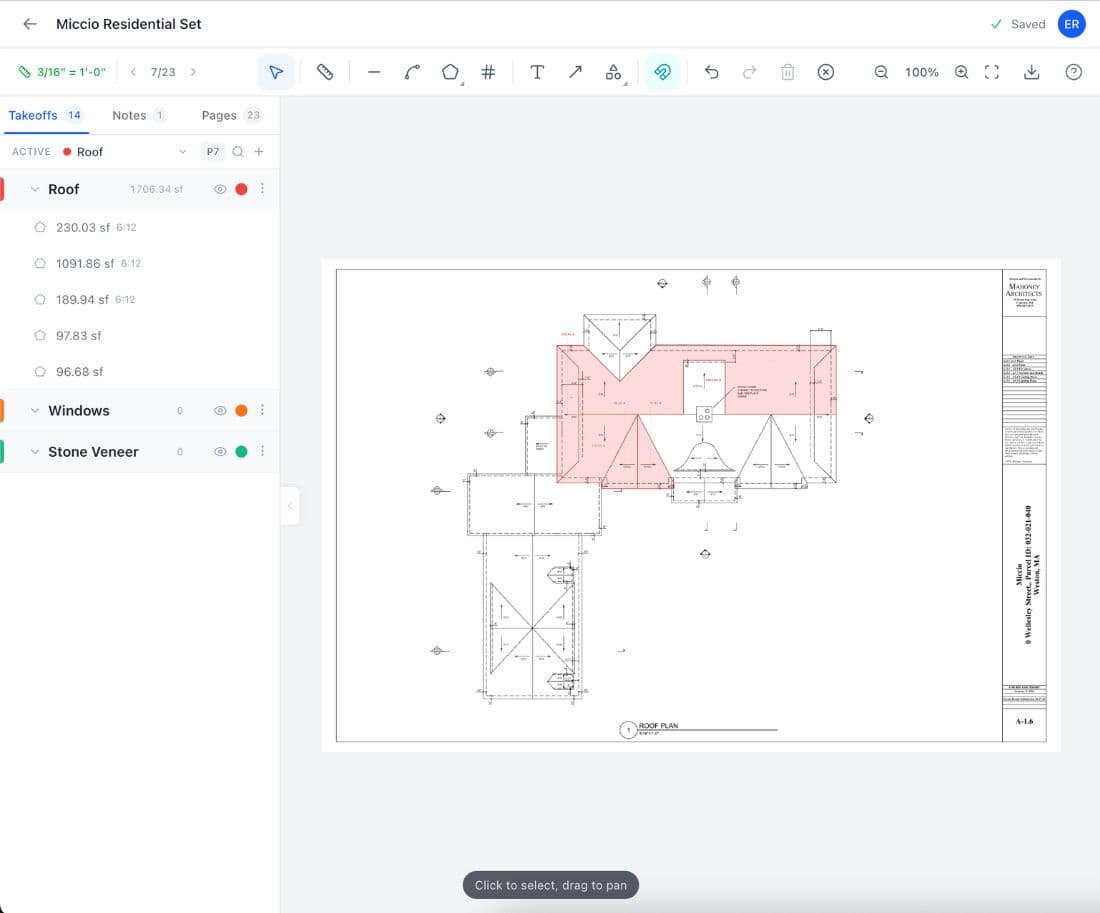
Organize your takeoff measurements with color-coded groups. Sixteen colors, running totals per group, sub-groups with hatch patterns, and visibility controls that let you focus on one scope at a time. Create groups by trade, floor, or material, and export organized quantities to a spreadsheet or annotated PDF. When a mid-size commercial project has a dozen active scopes across 30 pages of plans, groups keep every measurement sorted from the first click to the final bid.
How to Organize Takeoff Measurements with Groups
Create a Group
Name it by trade, scope, floor, or material. The tool picks the most visually distinct color from 16 options so each scope stands apart on the canvas. Add sub-groups for detailed breakdowns within a trade, like separating Hot Water from Cold Water under a Plumbing parent.
Measure into the Group
Select the active group from the sidebar and start measuring. Every line, area, and count you draw inherits that group's color automatically.
Review Running Totals
The sidebar shows cumulative length, area, count, volume, and wall area per group. Totals update in real time as you draw. Toggle visibility to focus on one scope at a time, or use Solo mode to isolate a single group on a busy drawing.
Export by Group
The CSV export organizes measurements by group with subtotals per scope and grand totals at the bottom. The annotated PDF renders each group in its own color on the original plans.
Why Do Organized Takeoffs Win More Work?
A mid-size commercial project produces 200 to 400 individual measurements across a dozen or more trade scopes. Without groups, those measurements sit in one flat list with one color on the canvas. Finding the drywall totals means scrolling past electrical, plumbing, painting, and demolition measurements that all look the same. On a 40 page plan set with fifteen active scopes, the search becomes the bottleneck. Measurement groups turn a flat list into an organized bid structure where every scope has its own color, its own running total, and its own visibility toggle.
The Construction Specifications Institute organizes all construction work into 50 MasterFormat divisions, from Division 01 (General Requirements) through Division 48 (Electrical Power Generation). Most commercial estimators structure their bids around these divisions, and measurement groups map naturally to the same approach. Name a group Electrical, another Plumbing, another Finishes, and your takeoff mirrors the bid structure. When the quantities are organized by scope from the start, they drop directly into your estimate without a manual sorting step.
When a general contractor issues a bid invitation, the scope of work is divided into bid packages that specialty contractors price individually. The electrical sub bids Division 26, the plumber bids Division 22, the drywall contractor bids Division 09. Each package requires quantities separated by trade with clear subtotals. If your takeoff is organized by group from the start, the CSV export already matches the bid package structure. There is no sorting step between measuring and pricing. The quantities go straight from the takeoff into the estimate, and the annotated PDF goes into the bid submission to show exactly what was measured.
Research compiled by the Lean Construction Institute estimates that 25 to 50 percent of labor time on construction projects goes to non-value activities, including searching for information and correcting errors. A survey by FMI Corporation of 599 construction leaders put a number on the problem: professionals spend 5.5 hours every week just searching for project data, scrolling through files, and reconciling numbers across disconnected documents. That search time is part of the non-value activities that cost the U.S. construction industry $177.5 billion in labor annually.
Measurement groups remove the search from your takeoff. Every scope is named, color-coded, and totaled in the sidebar. When you need the drywall footage, you look at the Drywall group. No scrolling, no filtering, no mental math. The line measurement tool handles linear runs, the count tool handles quantities, and groups keep every scope separated on the canvas and in the export. The quantities are organized from the first measurement through the final bid package.
Takeoff Tools Built for Every Trade
From flooring to full ground up builds, Easy Takeoffs handles the measurements your trade demands. Built for every trade, $39 a month.
What Can You Do with Measurement Groups?
Color, structure, running totals, visibility controls, and scope protection for every trade on the plan.
16 Distinct Colors
Choose from 16 colors arranged to maximize visual contrast: red, orange, amber, lime, green, emerald, teal, cyan, sky, blue, indigo, violet, fuchsia, pink, rose, and slate. When you create a new group, the auto-assign picks the color most distinct from your existing groups. Even with eight or ten groups on the same drawing, every scope stays visually separated at a glance. Colors carry through to the annotated PDF export, so printed plans show the same visual separation you see on screen.
Sub-Groups Nested Four Levels Deep
Create parent groups for broad scopes and nest sub-groups up to four levels deep for detailed breakdowns: Floor 2, then Unit 2A, then Plumbing, then Hot Water, Cold Water, and Waste inside it. Each sub-group gets a related color from its parent's family so connected scopes read together on the canvas. Assign a different hatch pattern to each sub-group, and area measurements render with distinct fills: crosshatch for tile, diagonal for carpet, dots for VCT. Seven patterns are available. Totals roll up through every level, and the structure mirrors how estimators break a project into buildings, units, and trade line items for pricing.
Running Totals per Group
Every group tracks its own cumulative totals in the sidebar: total linear footage for line and polyline measurements, total square footage for areas, total count for markers, and volume and wall area when depth or wall height values are set. Sub-group totals roll up to the parent automatically. Totals update in real time as you draw, delete, or move measurements. Groups can also have assembly templates attached, so every measurement in the group gets automatic material calculations. The group panel shows material quantities alongside measurement totals, giving you both the raw dimensions and the materials they require without opening a calculator or manually adding rows in a spreadsheet.
Three-State Visibility
Each group has three visibility states: fully visible, dimmed to 30 percent opacity, or completely hidden. Click the eye icon on a group to cycle between states. Use Solo mode to show one group and hide everything else, which is useful when you need to verify a single scope on a busy drawing. The dimmed state keeps other scopes visible as context without competing for attention. Hidden groups are excluded from exports, giving you precise control over what appears in your output files.
Lock to Prevent Changes
Lock any group to protect its measurements from accidental edits. Locked measurements cannot be selected, moved, deleted, or modified. This is useful after a scope has been verified by the lead estimator and you do not want the numbers changed while other scopes are still in progress. The lock icon turns amber when a group is protected. Unlock at any time to resume editing. All lock and unlock actions are undoable, so there is no risk in locking a group while you finish the rest of the takeoff.
Why Do Unorganized Takeoffs Cost Real Money?
Without groups, every measurement lives in one flat list. Here is what that costs you on real projects.
The Color Blob
All 300 measurements on the canvas share the same color. Flooring, demolition, electrical, and plumbing overlap on the same sheet in the same blue. You cannot tell which lines are conduit runs and which are baseboard. To figure out what belongs to which scope, you hover over each measurement individually, read its label, and try to piece the picture together. A 40 page plan set with fifteen active scopes becomes a single mass of overlapping blue lines. Sorting through that visual noise to find your plumbing quantities takes longer than measuring them did in the first place.
Scrolling Through 200 Measurements
The sidebar lists 200 measurements in the order you drew them, not by scope. Pipe runs sit between duct measurements and wire pulls. You need the total linear footage for copper pipe, but finding every pipe measurement means scrolling up and down, clicking each one to check whether it belongs to the plumbing scope or the fire protection scope. By the time you have your total, you have already forgotten whether you included the run on sheet M-3. One missed measurement means your material order is short. One duplicate means you ordered pipe you did not need.
The Wrong Number Goes in the Bid
You need the flooring area for your tile bid. You add up all the area measurements and get 3,400 square feet. But three of those areas were demolition scope, two were ceiling paint, and one was an accent wall. The actual flooring total is 2,600 square feet, not 3,400. At $12 per square foot installed, that is $9,600 of error in the bid. You either overbid and lose the project, or you win it and eat the overage. With separate measurement groups, the Tile Flooring group shows its own total. No mixing, no miscount, no scramble to untangle overlapping scopes at the last minute.
Re-Measuring When the Scope Changes
The GC splits the mechanical scope into two subcontracts midway through the bid. Ductwork goes to one sub, piping to another. All your mechanical measurements sit in one undifferentiated list. You cannot separate duct from pipe without re-measuring every run on every page. The deadline is tomorrow. You stay late, re-draw 80 measurements, and hope you land on the same numbers as the first time. With groups, you would create a Ductwork group and a Piping group, batch-move the measurements where they belong in minutes, and submit both bids with accurate totals.
Measurement Group Questions
Create a measurement group for each trade scope. Name groups by trade (Electrical, Plumbing, Drywall, Painting) or organize by material, floor, or building phase. Many commercial estimators align their groups with CSI MasterFormat divisions so the takeoff structure matches the bid format from the start. In Easy Takeoffs, select the active group from the sidebar before measuring. Every line, area, and count you draw inherits that group's color automatically. The sidebar shows running totals per group, so you always know your quantities for each scope without adding anything up by hand. When you export, the CSV organizes measurements by group with subtotals, ready to drop into your estimate.
Measurement groups are a way to separate takeoff measurements by category. Each group gets a name, a color, and its own running totals for length, area, and count. A typical setup might have groups for Flooring, Demolition, Electrical, Plumbing, and Framing, mirroring the bid packages on the project. Easy Takeoffs supports 16 color coded groups with sub-groups, hatch patterns for area fills, three state visibility controls, and group locking. Groups organize your measurements on the canvas and in your exports, so quantities are sorted by scope from the moment you start measuring through the final bid submission.
Easy Takeoffs offers 16 distinct colors for measurement groups: red, orange, amber, lime, green, emerald, teal, cyan, sky, blue, indigo, violet, fuchsia, pink, rose, and slate. The auto-assign order maximizes visual contrast between adjacent groups so you do not end up with two similar shades next to each other. Sub-groups automatically get a related color from their parent's family, giving you additional visual separation within a trade scope. On a drawing with ten or fifteen active groups, every scope stays visually distinct at a glance. You can also change a group's color at any time, and all measurements in that group update immediately on the canvas and in the export.
Yes. Groups nest up to four levels deep, so you can organize the way the job is actually built: a group for Floor 2, a sub-group for Unit 2A, a sub-group inside that for Plumbing, and sub-groups under Plumbing for Hot Water Supply, Cold Water Supply, and Waste. Each sub-group gets a related color from its parent's family so scopes stay visually connected on the canvas while remaining distinct from each other. Every group tracks its own running totals for length, area, and count, and parent totals roll up automatically to include everything inside. Hatch patterns can be set per sub-group to further distinguish area fills: crosshatch for tile, diagonal lines for carpet, dots for VCT. Hiding or locking a parent applies to everything inside it, and the structure mirrors how estimators break a project into buildings, units, and trade scopes for pricing.
Click the folder icon on any measurement in the sidebar to open the group picker. Select the target group and the measurement moves instantly, with its color and hatch pattern updating to match the new group. You can also select multiple measurements and batch-move them at once, which saves time when a general contractor splits a scope into separate subcontracts midway through the bid. Moving is also useful when a measurement was drawn into the wrong group by mistake. Measurements in locked groups cannot be moved until the group is unlocked.
Yes. The CSV export organizes measurements by group with subtotals for each scope and grand totals at the bottom. Each row includes the measurement label, dimensions, quantity, and the group it belongs to, so the spreadsheet is ready for estimating without manual sorting. The annotated PDF export renders each group's color on the original drawings so every scope is visually separated in the output. General contractors and project owners can see exactly which measurements belong to which trade at a glance. Hidden groups with their visibility turned off are excluded from both exports, so you can control exactly what appears in the file by toggling visibility before you download.
Yes. Each group has a three state visibility toggle: fully visible, dimmed to 30 percent opacity, or completely hidden. Click the eye icon on a group to cycle between states. Use Solo mode to show one group and hide all others, which is useful when you need to verify measurements for a single trade on a busy drawing without visual clutter from other scopes. The dimmed state keeps other scopes visible as context while making the active scope stand out. Hidden groups are excluded from both the CSV and PDF exports, giving you precise control over what appears in your output.
Hatch patterns are fill patterns applied to area measurements so you can visually distinguish different surfaces on the drawing. Instead of relying on color alone, hatch patterns add a second layer of visual identification that works even when a plan is printed in grayscale. Easy Takeoffs offers seven patterns: diagonal right, diagonal left, crosshatch, horizontal lines, vertical lines, dots, and solid fill. Assign a hatch pattern to any group or sub-group, and every area measurement in that group renders with that fill on the canvas and in the exported PDF. This is particularly useful for flooring takeoffs where tile, carpet, vinyl, and hardwood all need distinct visual representation on the same plan.
Start Your Construction Takeoff Today
Upload your first PDF plan set, set the scale, and pull accurate quantities before lunch. $39 a month after the trial, less than every dedicated competitor.